Posts

Showing posts with the label trends

The best way to understand what is Machine Learning

This is probably one of the best single page website that could explain what is Machine Learning using interactive visualizations: A visual introduction to machine learning Let's revisit the 73-m elevation boundary proposed previously to see how we can improve upon our intuition. Clearly, this requires a different perspective. By transforming our visualization into a histogram, we can better see how frequently homes appear at each elevation. More to come on ML!
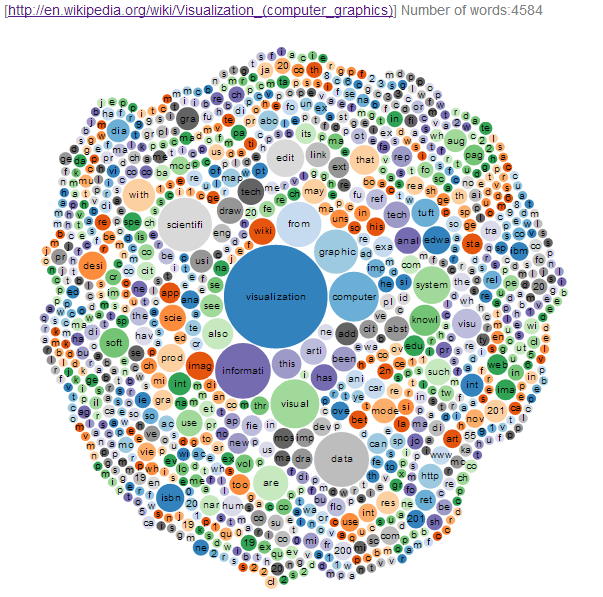
Some of the coolest visualizations in the programming dev/test world

Image
Here are a few interesting visualizations that I found while doing research for my talk about testing Insights, also included are the ones that I did not end up using: Open source contributions by location  http://davidfischer.github.io/gdc2/#languages/All GitHut - is an attempt to visualize and explore the complexity of the universe of programming languages used across the repositories hosted on GitHub. http://githut.info/ Who speaks what on GitHub? Visualization 1 is a chord diagram, which indicates the relationship between all possible combinations of programming languages. This data was computed by creating all possible pairs that could be created using the list of 20 languages I have analyzed. By analyzing the combinations, and the number of users that speak both of the languages in question, we get a good idea of what languages are spoken most, but also which languages are 'spoken' quite a lot, but not in combination. It gives a different perspective of th...

Test Automation skills for 2016

Image
I would not agree with all the graphs here but a good depiction of what's hot in the market: Source:  http://blog.testproject.io/2015/12/03/worlds-most-desirable-automation-skills/